3 Reasons for the Fertilizer and Food Shortage
Countries with the Highest Default Risk in 2022
The $100 Trillion Global Economy in One Chart
News Explainer: The Economic Crisis in Sri Lanka
Interest Rate Hikes vs. Inflation Rate, by Country
The Evolution of Media: Visualizing a Data-Driven Future
33 Problems With Media in One Chart
The Top Downloaded Apps in 2022
Synthetic Biology: The $3.6 Trillion Science Changing Life as We Know It
How Do Big Tech Giants Make Their Billions?
Mapped: The Salary You Need to Buy a Home in 50 U.S. Cities
Countries with the Highest Default Risk in 2022
What Does It Take To Be Wealthy in America?
Household Income Distribution in the U.S. Visualized as 100 Homes
Interest Rate Hikes vs. Inflation Rate, by Country
Visualizing the Relationship Between Cancer and Lifespan
Explainer: What to Know About Monkeypox
Visualizing How COVID-19 Antiviral Pills and Vaccines Work at the Cellular Level
Mapped: The Most Common Illicit Drugs in the World
Visualizing The Most Widespread Blood Types in Every Country
Which Countries Produce the Most Natural Gas?
Visualizing the World’s Largest Oil Producers
A Lifetime’s Consumption of Fossil Fuels, Visualized
Visualized: Battery Vs. Hydrogen Fuel Cell
Who’s Still Buying Fossil Fuels From Russia?
Ranked: The 20 Countries With the Fastest Declining Populations
Iconic Infographic Map Compares the World’s Mountains and Rivers
Mapped: A Decade of Population Growth and Decline in U.S. Counties
Mapped: The State of Global Democracy in 2022
Mapped: Solar and Wind Power by Country
Mapped: The 10 Largest Gold Mines in the World, by Production
The 50 Minerals Critical to U.S. Security
Visualizing China’s Dominance in Clean Energy Metals
The Periodic Table of Commodity Returns (2012-2021)
Visualizing the Abundance of Elements in the Earth’s Crust
Timeline: The Domestication of Animals
5 Things to Know About Europe’s Scorching Heatwave
What Are the Five Major Types of Renewable Energy?
Animation: The World’s Biggest Wind Turbines
Synthetic Biology: The $3.6 Trillion Science Changing Life as We Know It
Published
on
By
a.bg-showmore-plg-link:hover,a.bg-showmore-plg-link:active,a.bg-showmore-plg-link:focus{color:#0071bb;}
China is the world’s second largest economy after the U.S., and it is expected to eventually climb into the number one position in the coming decades.
While China’s economy has had a much rockier start this year due to zero-tolerance COVID-19 lockdowns and supply chain issues, our visualization covers a full year of data for 2021—a year in which most economies recovered after the initial chaos of the pandemic.
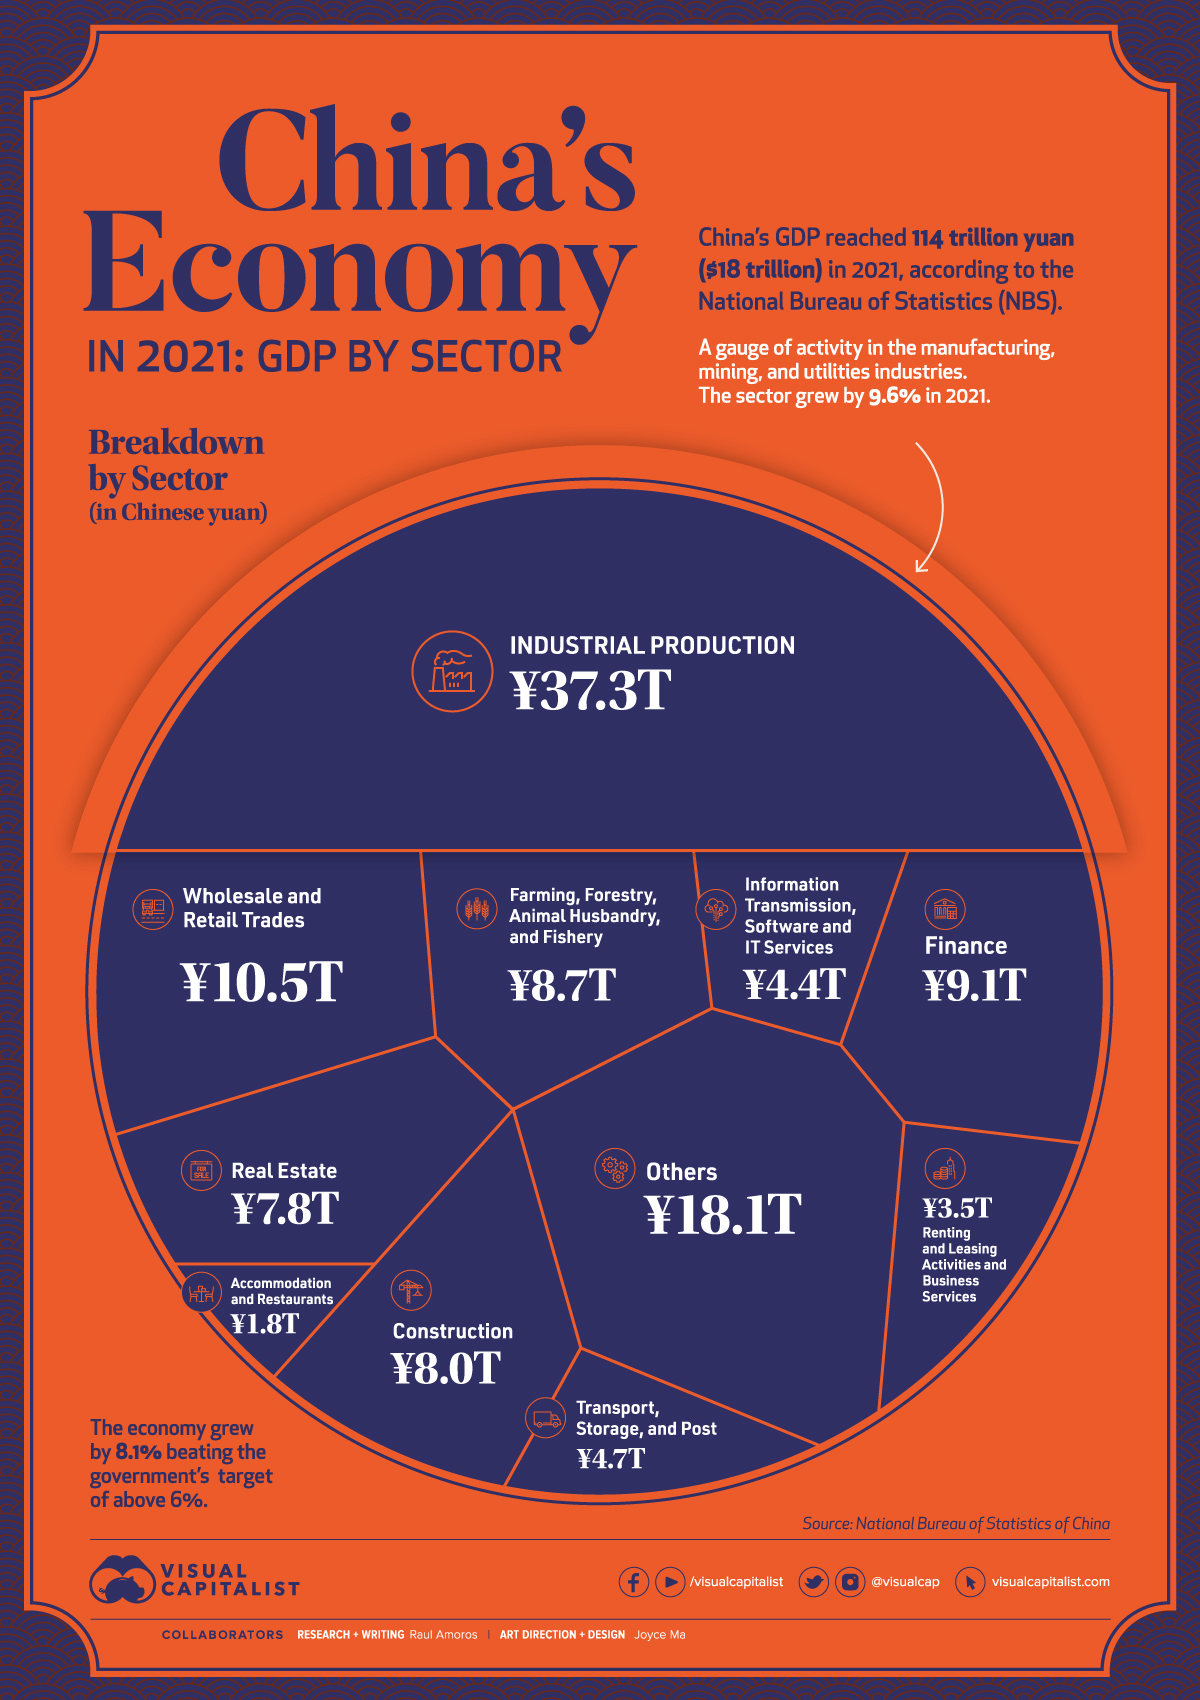
In 2021, China’s Gross Domestic Product (GDP) reached ¥114 trillion ($18 trillion in USD), according to the National Bureau of Statistics. The country’s economy outperformed government targets of 6% growth, with the overall economy growing by 8.1%.
Let’s take a look at what powers China’s modern economy.
Industrial production—activity in the manufacturing, mining, and utilities sectors—is by far the leading driver of China’s economy. In 2021, the sector generated ¥37.3 trillion, or one-third of the country’s total economic activity.
Despite a slowdown in December, wholesale and retail trades also performed strongly in 2021. As the main gauge of consumption, it was affected by lockdown measures and the spread of the COVID-19 Omicron variant towards the end of the year, but still rose by double digits, reaching a total of ¥10.5 trillion*.
“Other services”, which includes everything from scientific research and development to education and social services, generated 16% of China’s total economy in 2021, or ¥18.1 trillion.
*Editor’s note: At time of publishing, China’s government seems to have since adjusted this number to ¥11.0 trillion, which is not consistent with the original data set provided, but worth noting.
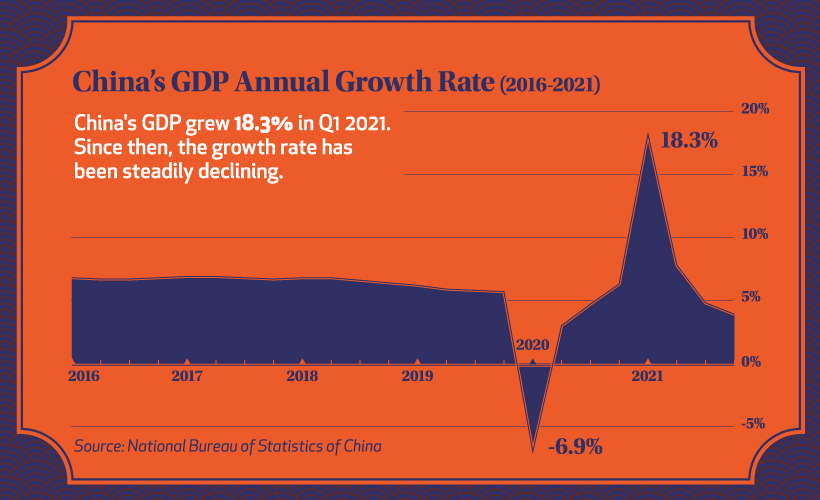
China’s economy recovered noticeably faster than most major economies last year, and as the overall trend below shows, the country has grown consistently in the years prior.
Before the pandemic hit, China’s quarterly GDP growth had been quite stable at just above 5%.
After the initial onset of COVID-19, the country’s economy faltered, mirroring economies around the globe. But after a strong recovery into 2021, resurging cases caused a new series of crackdowns on the private sector, slowing down GDP growth considerably.
With the slowdown continuing into early 2022, China’s economic horizon still looks uncertain. The lockdown in Shanghai is expected to continue all the way to June 1st, and over recent months there have been hundreds of ships stuck outside of Shanghai’s port as a part of ongoing supply chain challenges.
While every country reacted to the COVID-19 pandemic differently, China adopted a zero-COVID policy of strict lockdowns to control cases and outbreaks.
For most of 2021, the policy didn’t deter GDP growth. Despite some major cities fully or partially locked down to control regional outbreaks, the country’s economy still paced well ahead of many other major economies.
But the policy faced a challenge with the emergence of the Omicron variant. Despite lockdowns and an 88% vaccination rate nationally, seven out of China’s 31 provinces and all of the biggest cities have reported Omicron cases.
And China’s zero-COVID policy has not affected all sectors equally. Industrial production rose by more than 10% in the first 11 months of 2021, despite city lockdowns around the country. That’s because many factories in China are in suburban industrial parks outside the cities, and employees often live nearby.
But many sectors like hotels and restaurants have been more severely affected by city lockdowns. Many global economies are starting to transition to living with COVID, with China remaining as one of the last countries to follow a zero-COVID policy. Does that ensure the country’s economy will continue to slow in 2022, or will China manage to recover and maintain one of the world’s fastest growing economies?
Mapped: The 10 Largest Gold Mines in the World, by Production
Charted: U.S. Consumer Debt Approaches $16 Trillion
The $100 Trillion Global Economy in One Chart
AWS: Powering the Internet and Amazon’s Profits
Visualized: Which Countries are Dominating Space?
Who’s Still Buying Fossil Fuels From Russia?
3 Insights From the FED’s Latest Economic Snapshot
Visualizing the Coming Shift in Global Economic Power (2006-2036p)
Global wheat production is concentrated in just a handful of countries. Here’s a look at the top wheat-producing countries worldwide.
Published
on
By
Wheat is a dietary staple for millions of people around the world.
After rice and corn (maize), wheat is the third most-produced cereal worldwide, and the second-most-produced for human consumption. And considering wheat’s importance in the global food system, any impact on major producers such as droughts, wars, or other events, can impact the entire world.
Which countries are the largest producers of wheat? This graphic by Kashish Rastogi visualizes the breakdown of 20 years of global wheat production by country.
While more than 80 different countries produce wheat around the world, the majority of global wheat production comes from just a handful of countries, according to data from The Food and Agriculture Organization of the United Nations (FAO).
Here’s a look at the top 10 wheat-producing countries worldwide, based on total yield in tonnes from 2000-2020:
China, the world’s largest wheat producer, has yielded more than 2.4 billion tonnes of wheat over the last two decades, making up roughly 17% of total production from 2000-2020.
A majority of China’s wheat is used domestically to help meet the country’s rising food demand. China is the world’s largest consumer of wheat—in 2020/2021, the country accounted for approximately 19% of global wheat consumption.
The second-largest wheat-producing country is India. Over the last two decades, India has produced 12.5% of the world’s wheat. Like China, India keeps most of its wheat domestic because of significant food demand across the country.
Russia, the world’s third-largest wheat producer, is also the largest global exporter of wheat. The country exported more than $7.3 billion worth of wheat in 2021, accounting for approximately 13.1% of total wheat exports that year.
Because Russia and Ukraine are both significant global wheat producers, the ongoing conflict between the two countries has caused massive disruptions to the global wheat market.
The conflict has had an impact on adjacent industries as well. For instance, Russia is one of the world’s major fertilizer suppliers, and the conflict has led to a global fertilizer shortage which could lead to food shortages worldwide.
Bad weather, the war in Ukraine, and a shortage of fertilizer have led to fears of a global food crisis. Here are three factors you should know.
Published
on
By
This was originally posted on Elements. Sign up to the free mailing list to get beautiful visualizations on natural resource megatrends in your email every week.
Bad weather, the Russian invasion of Ukraine, and a shortage of fertilizer have led to fears of a global food crisis.
This infographic will help you understand the problem by highlighting three key factors behind the mounting food crisis.
Since the beginning of the Russian invasion of Ukraine in February 2022, the war has disrupted shipments of fertilizer, an essential source of nutrients for crops.
Russia is the world’s top exporter of nitrogen fertilizer and ranks second in phosphorus and potassium fertilizer exports. Belarus, a Russian ally also contending with Western sanctions, is another major fertilizer producer. In addition, both countries collectively account for over 40% of global exports of the crop nutrient potash.
Here are the top 20 fertilizer exporters globally:
The main destination of fertilizer exports from Russia are large economies like India, Brazil, China, and the United States.
However, many developing countries—including Mongolia, Honduras, Cameroon, Ghana, Senegal, and Guatemala—rely on Russia for at least one-fifth of their fertilizer imports.
Furthermore, the war intensified trends that were already disrupting supply, such as increased hoarding by major producing nations like China and sharp jumps in the price of natural gas, a key feedstock for fertilizer production.
The blockade of Ukrainian ports by Russia’s Black Sea fleet, along with Western sanctions against Russia, has worsened global supply chain bottlenecks, causing inflation in food and energy prices around the world.
This is largely because Russia and Ukraine together account for nearly one-third of the global wheat supply. Wheat is one of the most-used crops in the world annually, used to make a variety of food products like bread and pasta. Additionally, Ukraine is also a major exporter of corn, barley, sunflower oil, and rapeseed oil.
As a result of the blockade, Ukraine’s exports of cereals and oilseed dropped from six million tonnes to two million tonnes per month. After two months of negotiations, the two countries signed a deal to reopen Ukrainian Black Sea ports for grain exports, raising hopes that the international food crisis can be eased.
Besides the war in Ukraine, factors including the COVID-19 pandemic and climate change resulted in nearly one billion people going hungry last year, according to United Nations.
France’s wine industry saw its smallest harvest since 1957 in 2021, with an estimated loss of $2 billion in sales due to increasingly higher temperatures and extreme weather conditions.
Heat, drought, and floods also decimated crops in Latin America, North America, and India in recent months. Between April 2020 and December 2021, coffee prices increased 70% after droughts and frost destroyed crops in Brazil.
In the face of multiple crises, the World Bank recently announced financial support of up to $30 billion to existing and new projects in areas such as agriculture, nutrition, social protection, water, and irrigation.
The $100 Trillion Global Economy in One Chart
Ranked: The 20 Countries With the Fastest Declining Populations
Countries with the Highest Default Risk in 2022
Visualizing the World’s Largest Oil Producers
Mapped: The Salary You Need to Buy a Home in 50 U.S. Cities
Visualizing Which Countries Drink the Most Beer
Timeline: The Domestication of Animals
Which Countries Produce the Most Natural Gas?
Copyright © 2022 Visual Capitalist


