Khanchit Khirisutchalual
Khanchit Khirisutchalual
The stock market rally that began in mid-June has been driven almost exclusively by the realization that the risk of the Fed over-tightening in order to fight inflation has declined meaningfully. That realization, in turn, has been driven by a growing body of evidence which points to a perceptible lessening of inflation pressures: an impressive slowdown in the growth of M2 this year (which I last documented here), a rather impressive selloff in the commodity markets (Chart #5 in this post), and a distinct cooling of the real estate market (a sudden slackening in housing demand has allowed mortgage rates to decline from 6% to 5% in just the last month). At the same time, there is very little evidence to suggest that the economy is in distress: swap spreads remain relatively low (i.e., liquidity is abundant, the opposite of what we would expect to see if monetary policy were actually tight), and credit spreads are only moderately elevated (i.e., the outlook for corporate profits remains healthy), and of course jobs growth remains robust (July job creation was surprisingly strong). In any event, the debate over whether the economy is in a recession hardly matters. If inflation is cooling, the Fed has no reason to raise rates until the economy collapses. If the bond market is right (and it usually is), then the Fed is likely to raise rates from today’s 2.5% to a peak of maybe 3.25% in the next 6 months or so, and that is simply not the stuff of which recessions are made.
Chart #1
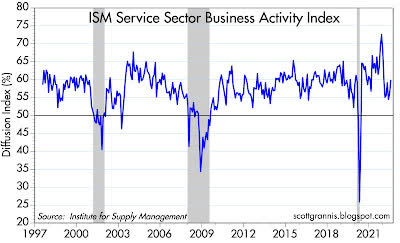
Chart #1 shows that business activity in the all-important service sector of the economy (the source of about 75% of GDP) remains healthy. Not booming, but well above levels that would be consistent with a recession.
Chart #2
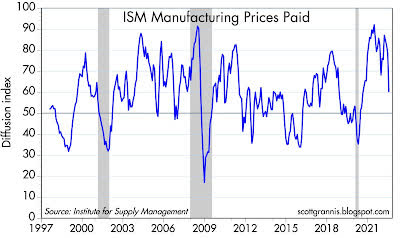
Since the vast majority of commodity prices having fallen significantly from their recent highs, a much smaller number of manufacturers now are reporting paying higher prices (Chart #2).
Chart #3
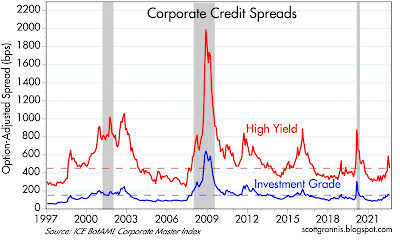
Chart #3 shows the level of spreads of investment grade and high yield corporate debt. This is the difference between the yields on corporate bonds and the yield on comparable maturity Treasury bonds, an excellent indicator of corporate credit risk, which in turn is heavily influenced by the outlook for the economy and corporate profits. This is pretty good evidence that the economy is not in a recession. (I’m no fan of Biden, but he is not crazy when he claims the economy is not in recession.)
Chart #4
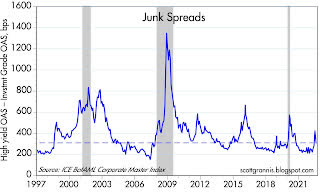
Chart #4 is simply the difference between the two lines in Chart #3, which is commonly referred to as the “junk spread.” Today, junk bonds (corporate bonds rated below investment grade) are priced to a fairly modest level of risk to the economy. If we were in a typical recession they would be substantially higher.
Chart #5
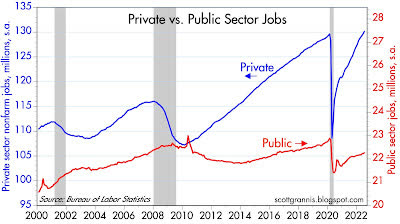
Chart #5 compares the number of jobs in the private and public sectors of the economy. Private sector jobs have now fully recovered from their pre-Covid levels, but they have yet to make significant gains. In the absence of the Covid shutdowns, they would likely be at least 3-5 million higher. Public sector jobs, in contrast, haven’t budged for over a decade! That’s progress in my book; private sector jobs are much more productive than public sector jobs.
Chart #6
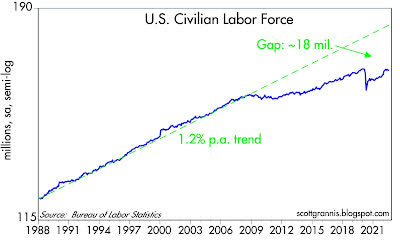
Chart #6 shows the level of the civilian work force – the portion of the population that is of working age and willing to work. This is an excellent example of the failure to thrive. Today’s workforce is at least 18 million people smaller than it might have been with different incentives. Meager growth in the number of people working or willing to work translates directly into subpar growth for the economy as a whole (most small business owners continue to report that one of their biggest problems is being unable to fill job openings).
Things could be better, but they could also be a lot worse.
Original Post
Editor’s Note: The summary bullets for this article were chosen by Seeking Alpha editors.
This article was written by